Visual References
Polished diagrams covering key concepts from the AWS Certified AI Practitioner (AIF-C01) curriculum. Each diagram is paired with a brief explanation of the underlying concept.
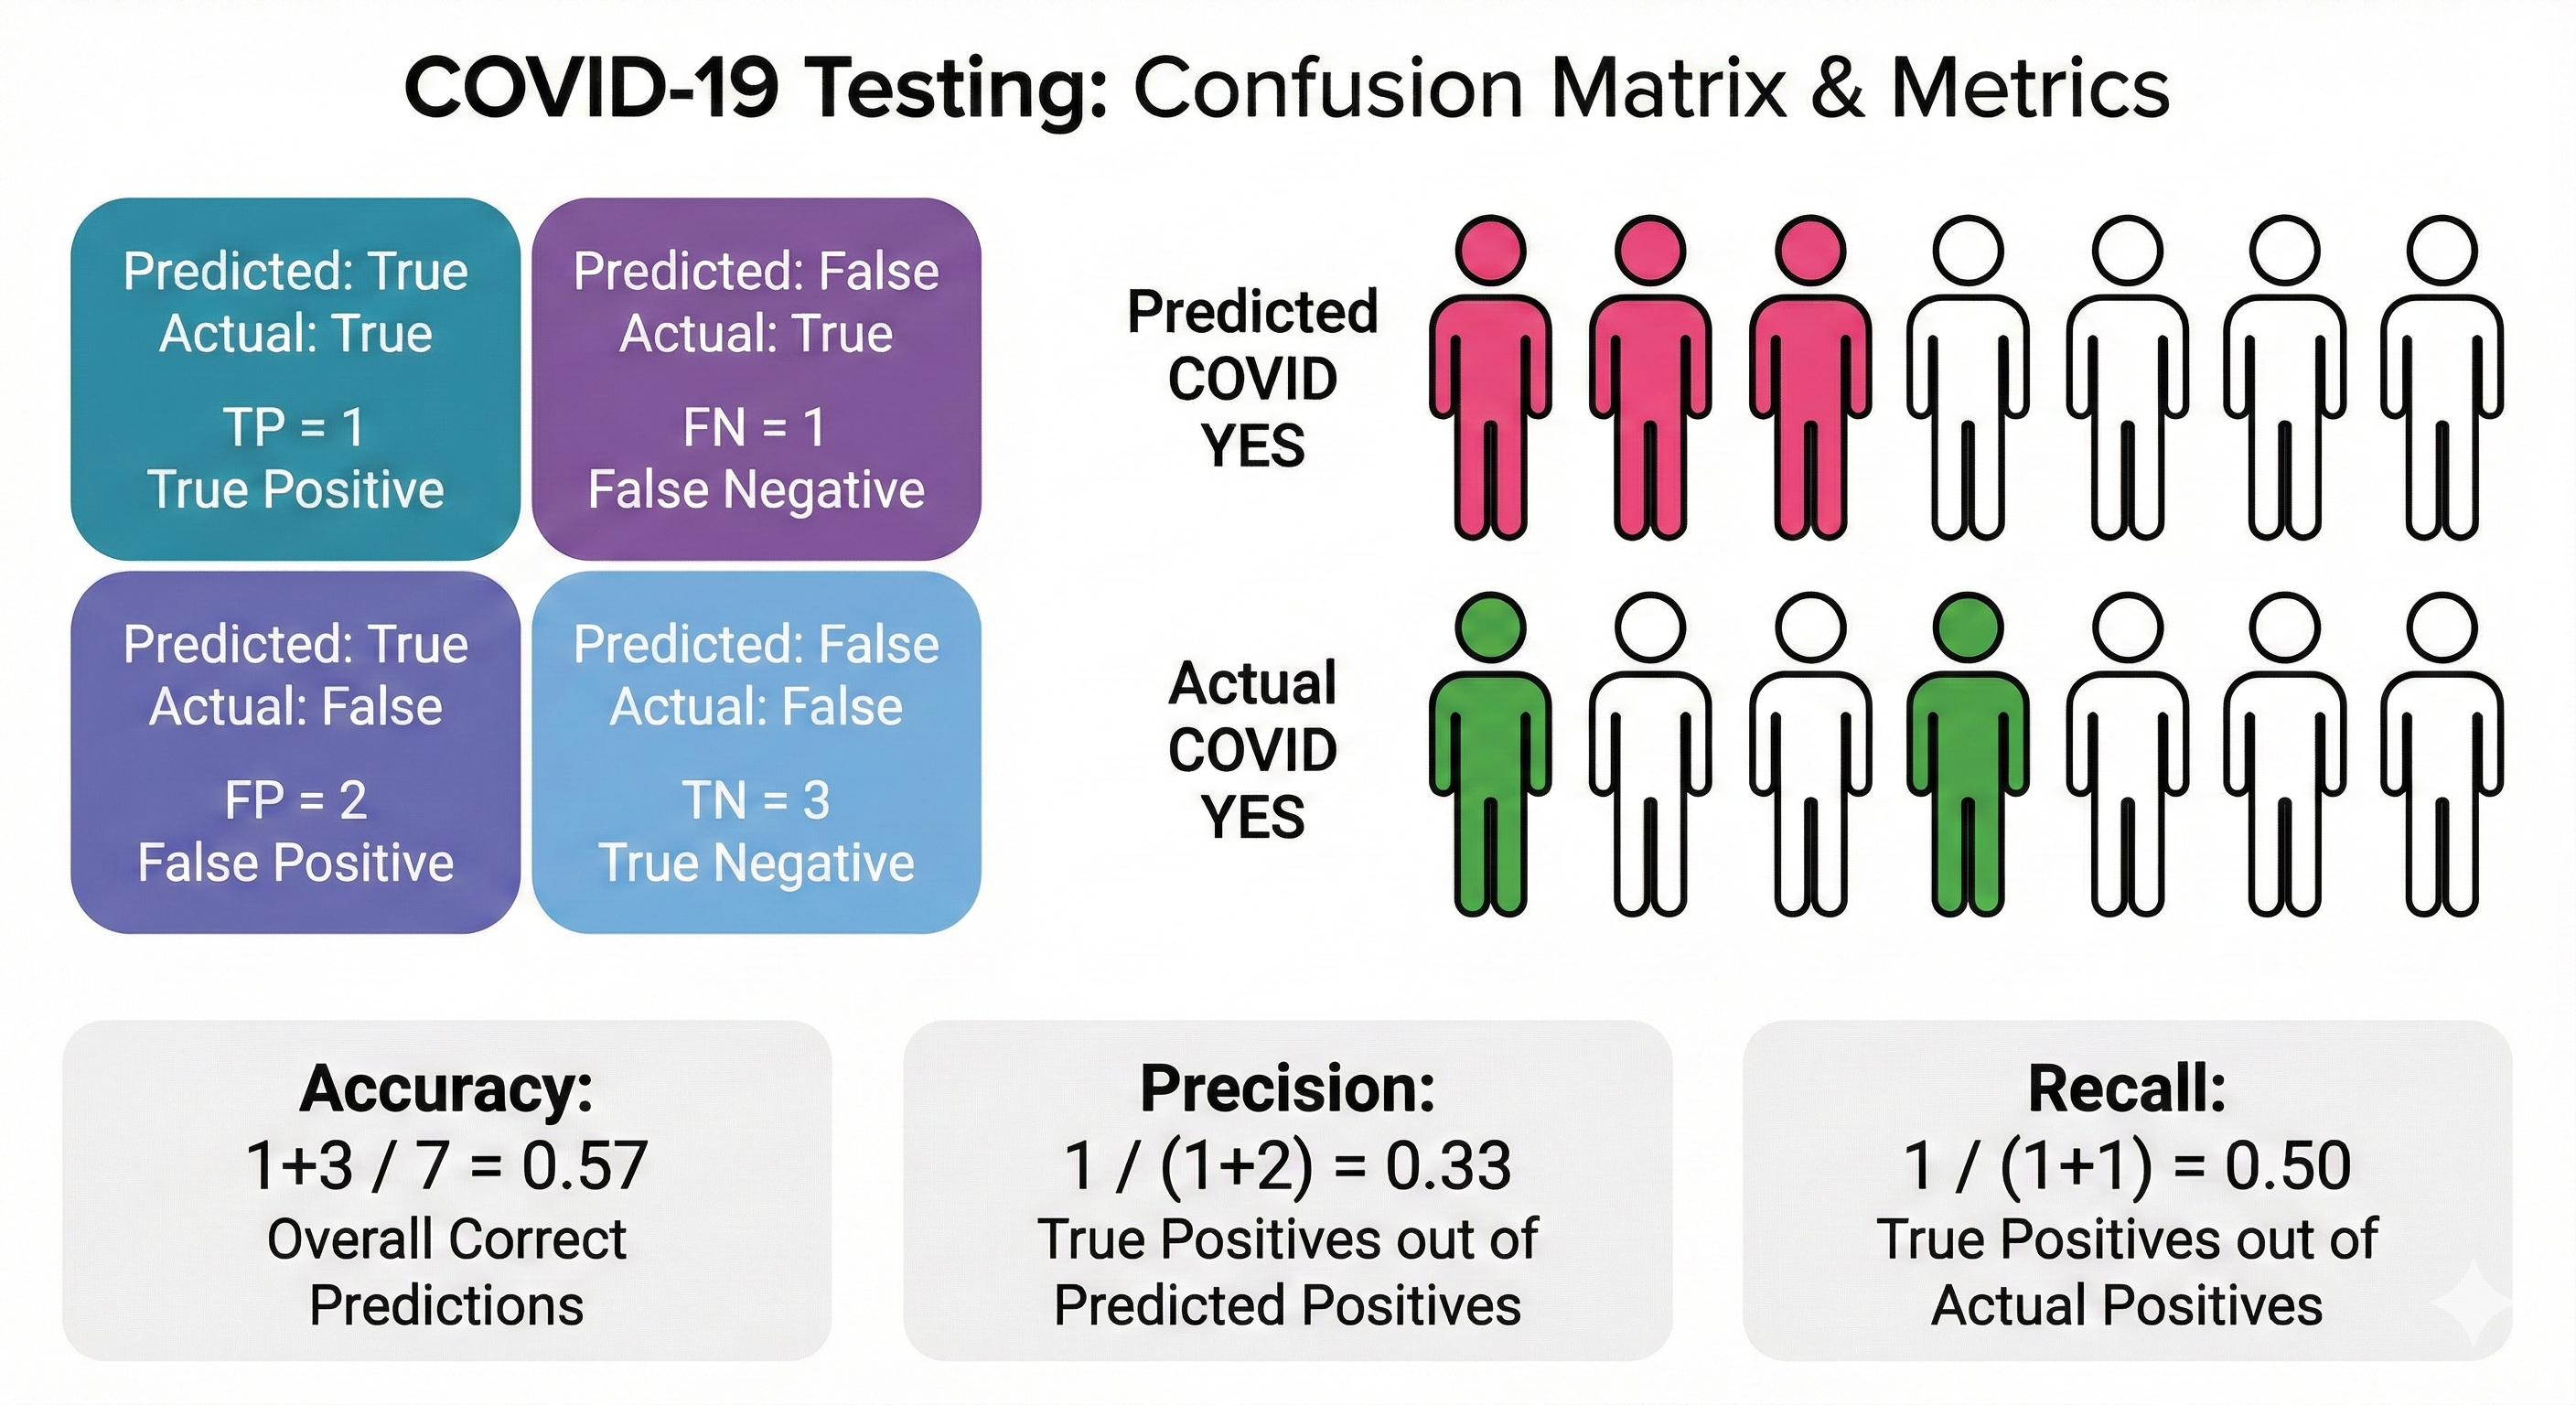
Confusion Matrix & Classification Metrics
A confusion matrix organizes a classifier's predictions against actual outcomes into four quadrants: True Positives, False Positives, True Negatives, and False Negatives. From these counts, we derive key metrics — accuracy measures overall correctness, precision captures how many predicted positives are truly positive, and recall captures how many actual positives were found. The diagram below uses a COVID-19 testing scenario to make these abstractions concrete: out of seven people tested, you can trace exactly how each metric is calculated.
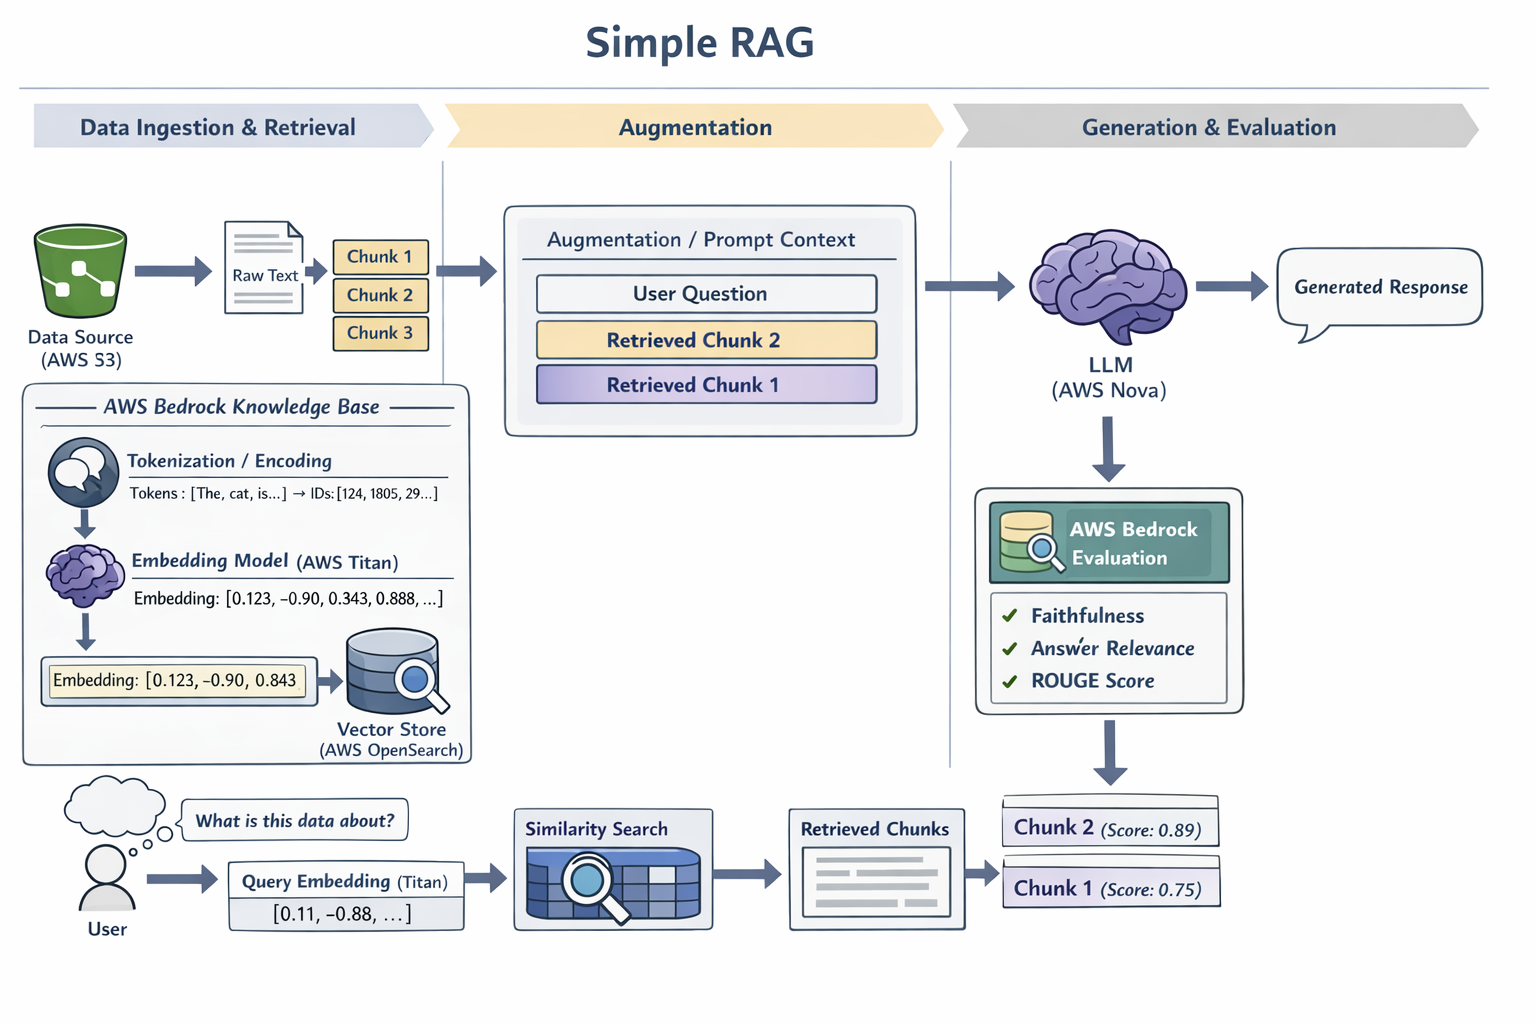
Simple RAG Pipeline
Retrieval-Augmented Generation (RAG) grounds an LLM's responses in your own data. This diagram traces the end-to-end workflow on AWS: documents in S3 are chunked and embedded using Amazon Titan, then stored as vectors in OpenSearch. At query time, the user's question is embedded and a similarity search retrieves the most relevant chunks. These are injected into the prompt context alongside the original question, and an LLM (such as Amazon Nova) generates a grounded response. The pipeline closes with Bedrock Evaluation checking faithfulness, answer relevance, and ROUGE scores.
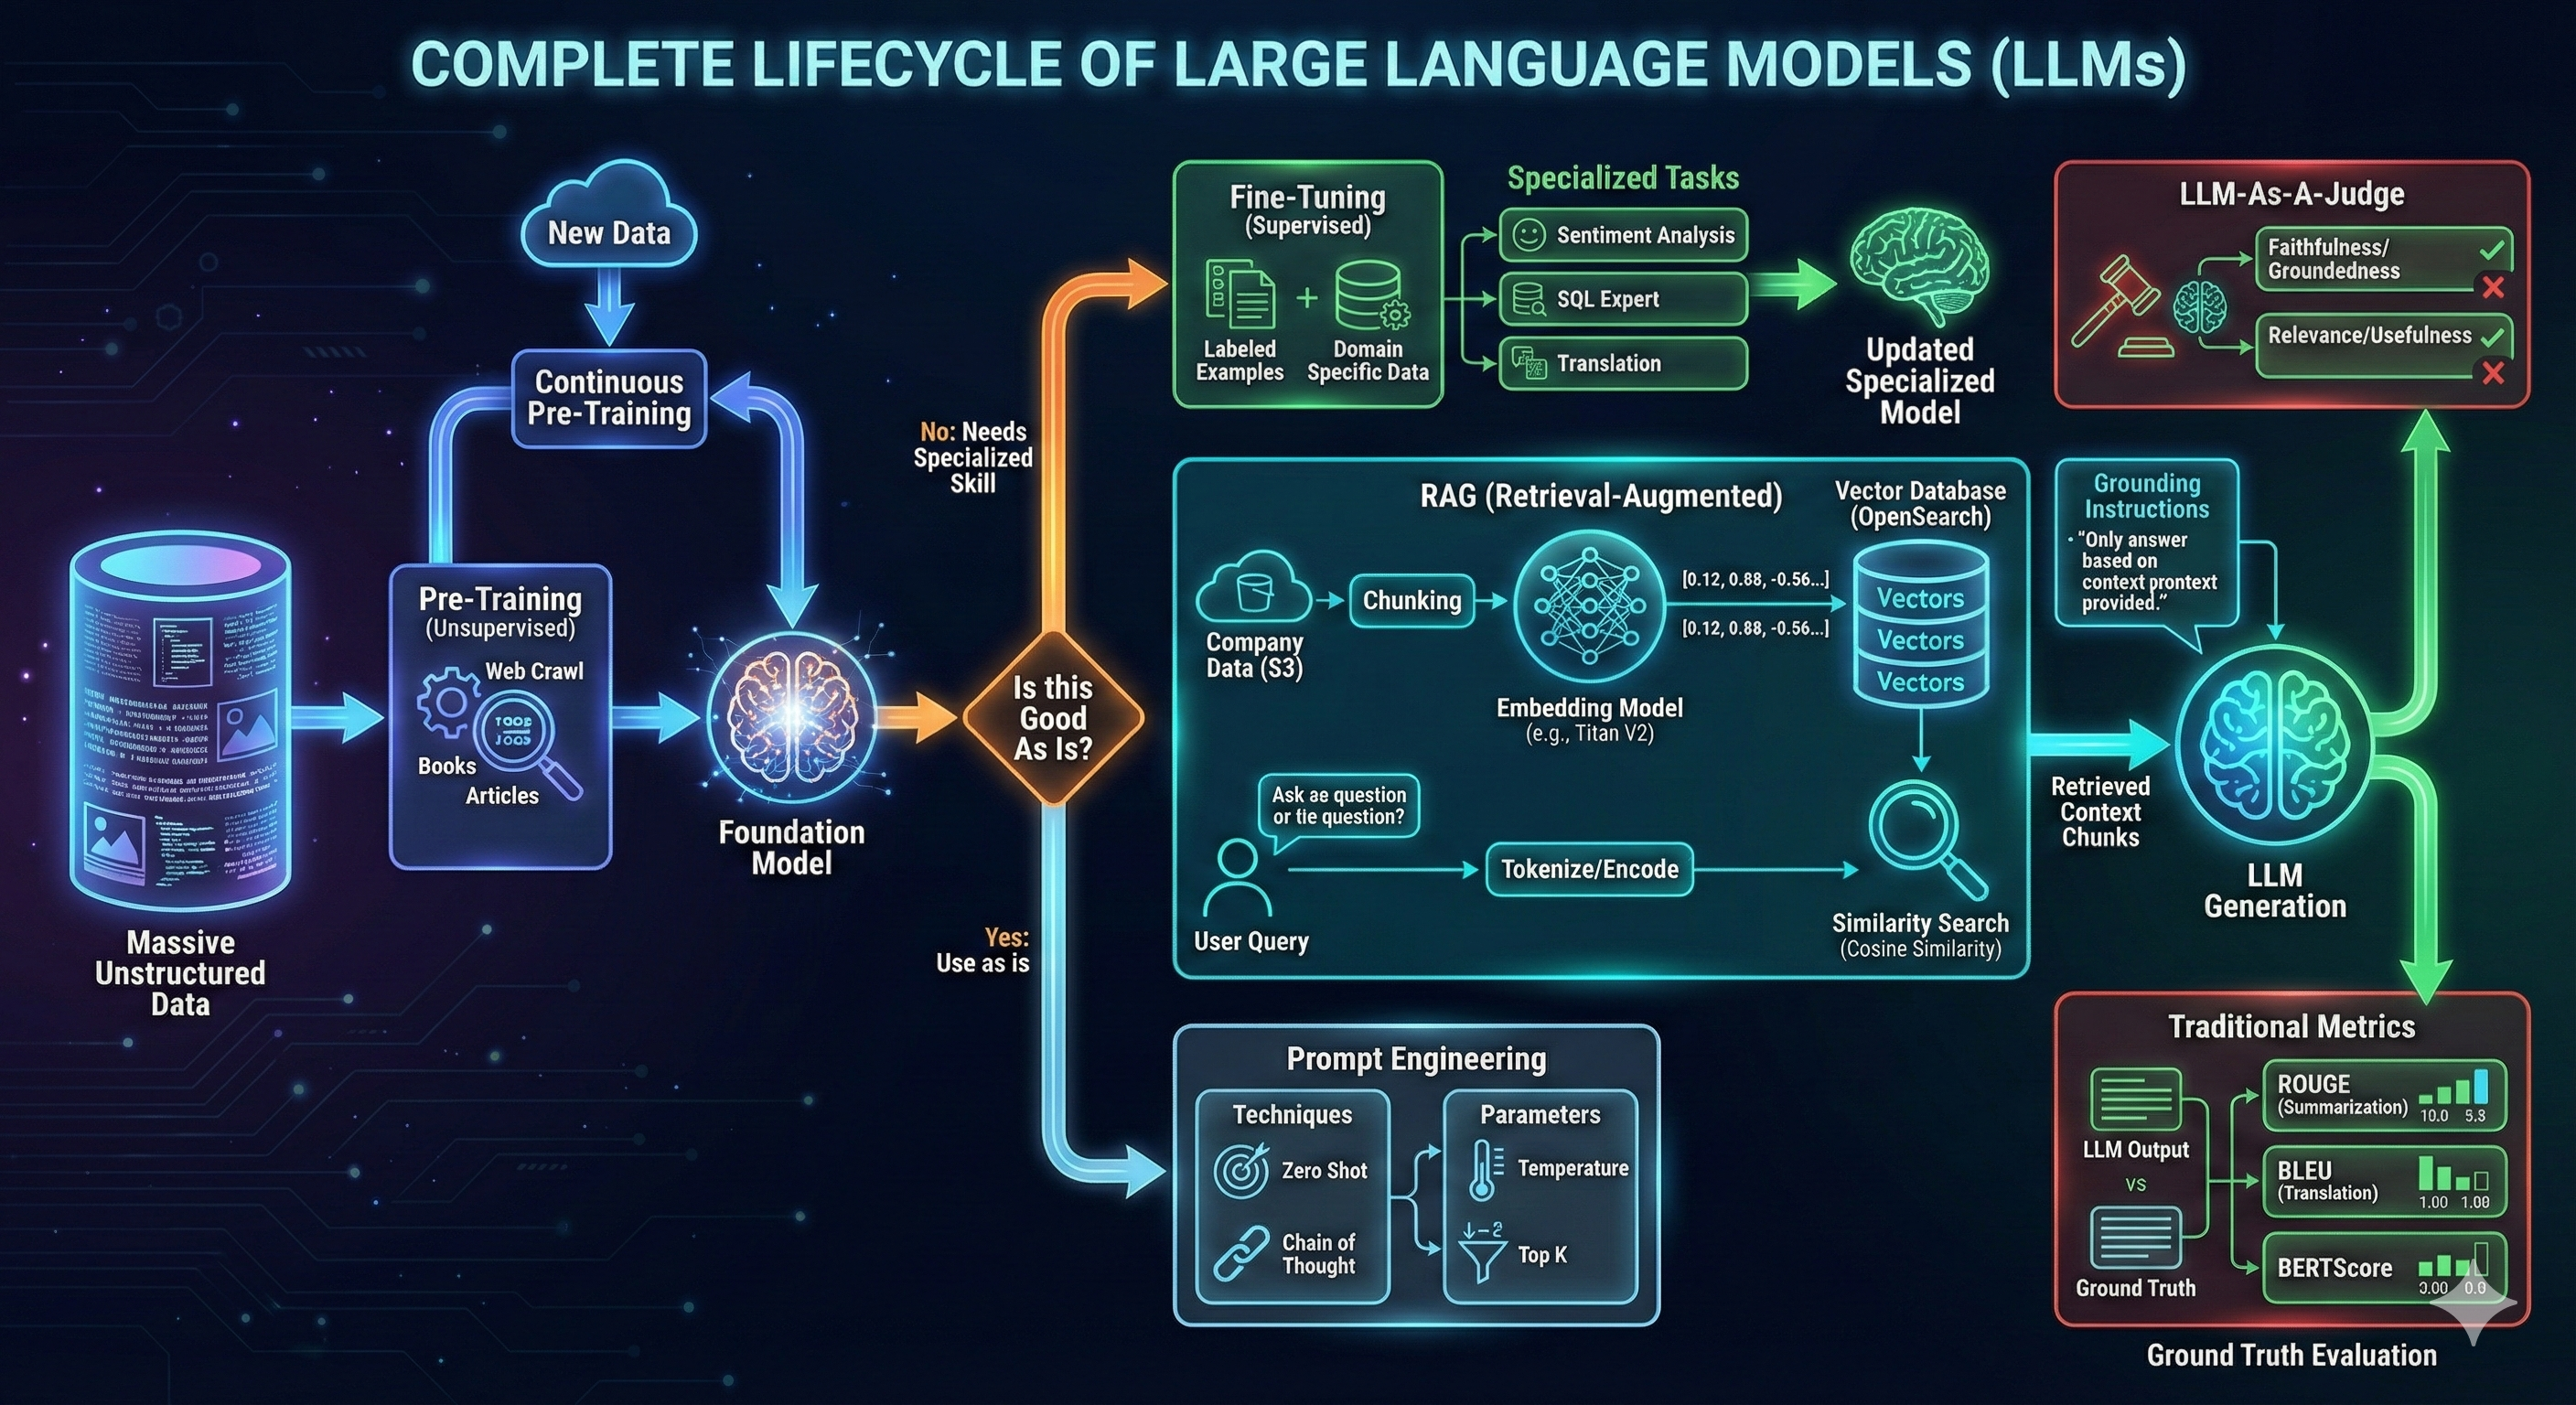
Complete Lifecycle of Large Language Models
This diagram maps the full LLM lifecycle. It starts with pre-training on massive unstructured data (web crawls, books, articles) to produce a foundation model. From there, a key decision: use the model as-is, fine-tune it with labeled domain data for specialized tasks, or augment it with RAG to ground outputs in enterprise knowledge. Prompt engineering techniques — zero-shot, chain-of-thought — and parameters like temperature and top-k further shape model behavior. The cycle closes with evaluation: traditional metrics (ROUGE, BLEU, BERTScore) for measurable tasks and LLM-as-a-judge for subjective qualities like faithfulness and relevance.